
The views expressed are those of the authors at the time of writing. This information does not constitute, and should not be construed as, an offer of advisory services, securities or other financial instruments, a solicitation of an offer to buy any security or other financial instrument, or a recommendation to buy, hold or sell a security or other financial instruments in any jurisdiction.
By André Perold & Maggie Fiore
A rising tide tends to lift all boats… or does it? This summer, the proportion of S&P 500 companies with a negative beta to the index (measured using three months of daily returns) reached its highest level since at least 1990 – approximately 44% – more than double the previous high of approximately 17%, set during the Tech Bubble in early 2001.
While it has felt for some time now that an “AI factor” has been driving equity markets—creating extreme dispersion between “AI winners” and “AI losers”— large cap stocks still tended to move together.
In the third quarter, however, a substantial portion of S&P 500 constituents saw their beta to the index, which measures both the direction and magnitude of a stock’s sensitivity to the index, go negative. The sheer strength of AI’s impact on the market has become so powerful that many stocks which are unexposed to “AI” are now moving in opposition to the predominant force driving the index.
% Companies in S&P with Negative Beta to S&P 500[1]
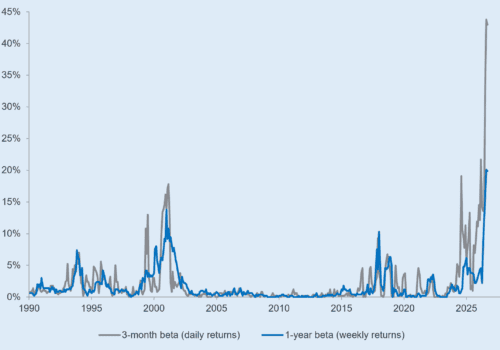
Of course, there will always be varied performance within an index, but the prevalence of negative beta stocks suggests that the index has stopped behaving like a coherent market and can instead be partitioned into several groups: (1) defensive, negative beta stocks which act as a diversifier against an index which is increasingly driven by tech, (2) high-beta, levered bets on the AI buildout and the economy’s reliance on that technology, and (3) the rest, which still largely trade on fundamentals with a moderate, positive sensitivity to the index (a beta of roughly 0.5).
In looking at companies at both ends of the beta spectrum, the thematic division is clear: the high beta group spans the AI value chain, dominated by semiconductors; the negative beta group forms a diversified basket of stocks either with limited exposure to the AI capex cycle or with direct vulnerability to AI’s buildout. Notably, while many sectors and industries fall firmly into one category, there are several – such as software – which are bifurcated because individual companies within the group are perceived to have different fates in an AI-dominated world. In the case of software, high beta names are AI enablers and beneficiaries like Microsoft, Oracle, and Palantir; negative beta names are “AI-threatened” companies such as Intuit, Workday, and Adobe.
S&P 500 Constituents by Beta Bucket[2]
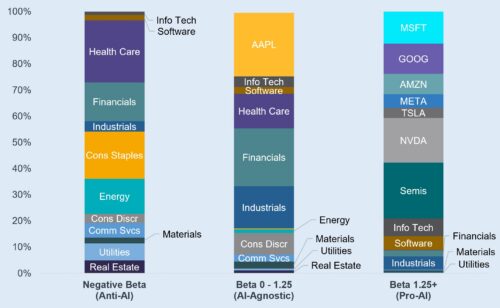
We accordingly will refer to the negative beta group as “Anti-AI,” the moderate beta group as “AI Agnostic,” and the high beta group as “Pro-AI.” While sorting on beta is backward looking and therefore prone to some amount of selection bias, we feel the coherence within the buckets makes this categorization useful for thinking about today’s drivers of portfolio risk and return.
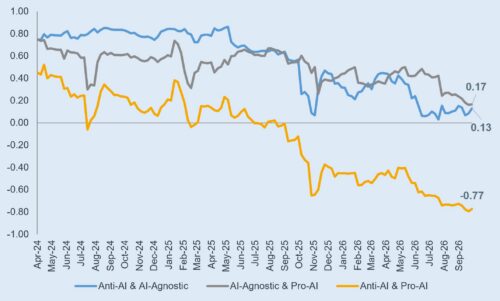
The Pro-AI group, while only 103 stocks, comprises almost half of the market cap and unsurprisingly drove returns over the last year. What’s remarkable is that the index has remained so calm despite the Pro-AI basket having such high volatility (30%). That’s because not only have the other two baskets experienced low volatility (each approximately 11%), but also because the correlations between the baskets have been very low to even negative. In other words, while the index volatility resembles any other “normal” year, looking under the hood tells a very different story[3].

And the Anti-AI and Pro-AI baskets, now strongly negatively correlated, were positively correlated with one another as recently as August 2025.
Correlations Between Beta Buckets (Trailing 6m)[4]
How could a portfolio that must hold all three groups be optimized? If the assumption is that each had a 5% going-forward risk premium and that today’s correlations and volatilities would continue, the Sharpe ratio could be theoretically maximized by allocating most of the capital to the Anti-AI group (69%), some to Pro-AI (22%), and just a bit to AI-Agnostic (9%). This Pro-AI exposure is about half that of its market weight but still of significant size given its very high volatility. It’s a risk exposure that is theoretically dampened by its assumed negative correlation with the Anti-AI bucket.
If instead it was believed that the market weights of these groups are already Sharpe-optimal—and that the market had an overall 5% going forward risk premium—the implied risk premia for the individual buckets (calculated as beta * 5% risk premium) equate to requiring a high additional return to hold Pro-AI stocks, and a negative risk premium for Anti-AI stocks.
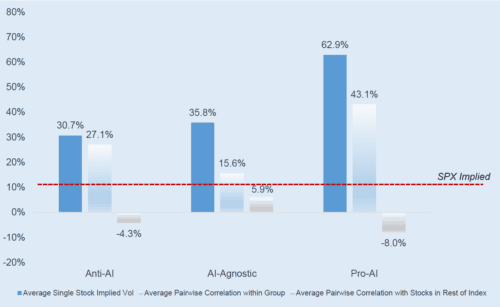
Individual stock implied volatility—the options market-derived estimate of future price moves—tells a similar story. The implied volatility of the index is quite normal at ~13%, but the individual stock implied volatilities of the Pro-AI group are nearly five times higher. The market’s projected calm is relying heavily on the low and negative correlations that the index constituents currently have to one another. If the vols remained elevated but correlations increased significantly, as is often the case in a market selloff, the index volatility would increase dramatically.
Individual stock implied volatility—the options market-derived estimate of future price moves—tells a similar story. The implied volatility of the index is quite normal at ~13%, but the individual stock implied volatilities of the Pro-AI group are nearly five times higher. The market’s projected calm is relying heavily on the low and negative correlations that the index constituents currently have to one another. If the vols remained elevated but correlations increased significantly, as is often the case in a market selloff, the index volatility would increase dramatically.
Single Stock Volatility and Correlation[5]
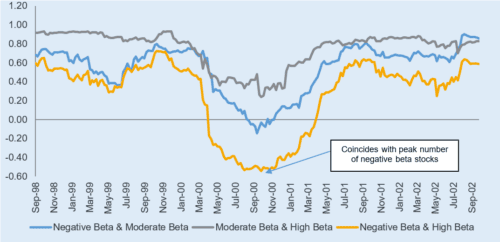
When have we seen this before? We replicated today’s analysis for the Dot Com era, again sorting stocks into buckets based on negative/moderate/high betas at the point in time where the proportion of negative beta stocks last peaked (late 2000).[6]
Through the lenses of correlation and volatility, that period rhymes a lot with what we are seeing today: a market driven by high return, high volatility tech names and dampened by defensive stocks uninvolved with the technological revolution at that time.
If you follow the market forward from that point, you can see that the peak in the number of negative beta stocks almost perfectly coincides with the start of S&P 500’s decline from its peak in the Dot Com era.
Dot Com Era Correlations[7]
Dot Com Era Returns (Indexed to 100)[8]
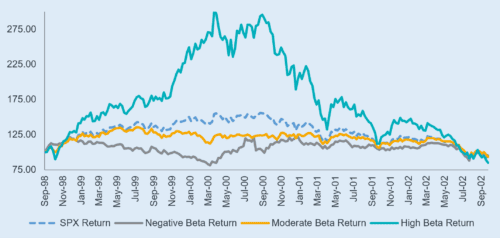
We are not concluding that a collapse similar to the one back then is imminent, but this is a dynamic that merits attention. We believe a market characterized by such extreme dispersion creates extraordinary opportunities for active management, where a portfolio can be systematically designed to compartmentalize both targeted AI-bets and diversifying defensive investments. The historically low levels of within-index correlation also provide interesting ways to hedge against that correlation reverting into positive territory.
About the Authors
 Andre Perold, Co-Founder & CIO
André is a Co-Founder and Chief Investment Officer of HighVista Strategies and a Partner of the firm. He was previously the George Gund Professor of Finance and Banking at Harvard Business School where he served in senior roles including Senior Associate Dean and Chair of the Finance Faculty. André’s research and teaching were in investment management and the capital markets, for which he won numerous awards. André is a Board Member of RIT Capital Partners and served on the Board of The Vanguard Group for more than 20 years, from 2004 to 2026. He has also served on a number of investment committees of not-for-profit institutions, including Mass General Brigham. He received a BSc (Hons) from the University of Witwatersrand, Johannesburg, and an MS and PhD from Stanford University.

Maggie Fiore, Vice President, Public Markets
Maggie is a Vice President at HighVista Strategies and focuses on the firm’s public markets investing. Prior to joining HighVista in 2022, Maggie was an associate at Goldman Sachs in the investment banking division. Previously, she worked at Bank of America in the capital markets group. She received a BA from Boston College.
Important Disclosure
The views and opinions expressed here reflects the judgments and opinions of the authors at the time of writing, does not purport to be complete, and are subject to change. No obligation to update or otherwise revise such views and opinions is being assumed. This discussion does not constitute, and should not be construed as, an offer of advisory services, securities or other financial instruments, a solicitation of an offer to buy any security or other financial instrument, or a recommendation to buy, hold or sell a security or other financial instruments in any jurisdiction. References to specific securities, issuers, and strategies are for illustrative purposes only, may or may not be currently held by HighVista Strategies LLC in a direct or indirect capacity, and are not intended to be, and should not be interpreted as, an indication that an investment has been or will be profitable. Use of information from sources referenced herein does not represent any sponsorship, affiliation, or other relationship between HighVista or the speakers, and any other company or entity, and does not constitute an endorsement. Nothing contained herein constitutes investment, consulting, legal, tax, accounting, or other advice, nor is it intended to be relied on in making an investment or other decision. Information provided herein is based upon data and analysis that is believed to be accurate as of the time of writing, but no representation or warranty is made herein. Any reproduction or distribution of this presentation, in whole or in part, or the disclosure of its contents, without the prior written consent of HighVista is prohibited. THIS PRESENTATION CONTAINS FORWARD-LOOKING STATEMENTS WITHIN THE MEANING OF THE U.S. FEDERAL SECURITIES LAWS. FORWARD-LOOKING STATEMENTS ARE THOSE THAT PREDICT OR DESCRIBE FUTURE EVENTS OR TRENDS AND THAT DO NOT RELATE SOLELY TO HISTORICAL MATTERS. FOR EXAMPLE, FORWARD-LOOKING STATEMENTS MAY PREDICT FUTURE ECONOMIC PERFORMANCE, DESCRIBE PLANS AND OBJECTIVES OF MANAGEMENT FOR FUTURE OPERATIONS, PERFORMANCE AND RISK AND MAKE PROJECTIONS OF REVENUE, INVESTMENT RETURNS, RISK CALCULATIONS OR OTHER FINANCIAL ITEMS. FORWARD-LOOKING STATEMENTS CAN GENERALLY BE IDENTIFIED AS STATEMENTS CONTAINING THE WORDS “WILL,” “BELIEVE,” “EXPECT,” “ANTICIPATE,” “INTEND,” “CONTEMPLATE,” “ESTIMATE,” “ASSUME,” “TARGET” OR OTHER SIMILAR EXPRESSIONS. SUCH FORWARD-LOOKING STATEMENTS ARE INHERENTLY UNCERTAIN, BECAUSE THE MATTERS THEY DESCRIBE ARE SUBJECT TO KNOWN (AND UNKNOWN) RISKS, UNCERTAINTIES AND OTHER UNPREDICTABLE FACTORS, MANY OF WHICH ARE BEYOND CONTROL. NO REPRESENTATIONS OR WARRANTIES ARE MADE AS TO THE ACCURACY OF SUCH FORWARD-LOOKING STATEMENTS.
[1] Source: Goldman Sachs, Bloomberg
[2] As of 09/30/2026
[3] Returns, volatility, and betas calculated for 10/01/2025 – 09/30/2026 time period
[4] Source: HighVista Analysis, Bloomberg as of 09/30/2026
[5] Source: HighVista Analysis, Bloomberg; 90d volatility as of 09/30/2026, correlations calculated over 3m ending 09/30/2026
[6] Provided for informational purposes only, Dot Com era analysis is provided for illustrative purposes only and is not a representation of any specific portfolio or performance.
[7] Source: HighVista Analysis, Bloomberg as of 09/30/2026
[8] Source: HighVista Analysis, Bloomberg as of 09/30/2026